軟體動態測試
Designing Test Cases 設計測試案例
- Dynamic testing relies on good test cases
- Testing techniques are characterized by their different strategies how to generate test cases
- Testing effectiveness is not maximized by arbitrarily selected test cases since they may expose an already detected fault by some other test case and waste effort
- Number of test cases do not determine the effectiveness
Each test case should detect different faults
動態測試需依靠好的測試案例
- 任意選擇的案例無法將測試效率最大化,因為中間可能發生重複的情況,找到一些已經過檢測的缺陷,而白浪費了力氣。
- 所以測試案例的多寡不一定與效率持成正比,每個測試案例都應該針對不同的缺陷來設計。
- 如何產生測試個案因此就有許多不同的策略。
Testing from External
從外部測試意味著將軟體系統當作黑箱加以測試,以確認它是否符合系統當初的要求。黑箱測試主要針對以下類型的缺陷:
- 功能不對或遺漏
- 有瑕疵的介面
- 資料結構或外部資料存取的缺陷
- 初始化和終止條件錯誤等,各類型可以由行為觀察到的缺陷。由於重點在於驗證系統的功能,所以有時又稱為功能測試。
Functional Testing Strategies
- Equivalence class partitioning 等類分割
- Boundary value analysis邊界值分析
- Cause effect graph因果圖
- Decision table based testing決策表
功能測試的策略,主要可以分成以下幾類:等類分割、邊界值分析、因果圖、與決策表等四類。
Equivalence Class Partitioning
- Input values to a program are partitioned into equivalence classes.
Partitioning is done such that
-- program behaves in similar ways to every input value belonging to an equivalence class.
Test the code with just one representative value from each equivalence class
-- as good as testing using any other values from the equivalence classes.
最理想的測試情況是,每個測試案例都有特定的意義(如輸入資料的有效性等),從而減少使用測試案例的數目。等類分割即是根據以上邏輯來的,其基本假設是程式的輸入值可被分成若干個等類集合,而每個等類集合所導致的系統行為表現相似。由於如此,每個集合只要選取一個代表案例來測試,即等同於測試整個集合。 等類集合是一個數學的概念,當物件之間的關係具有對稱性、傳遞性與自反性時,就存在等類關係。一個等類集合代表一組輸入條件的有效或無效的狀態。典型的情況是,輸入條件通常是一個特定的數值,一個數值域,一組相關值或一個布林條件。
- 如何決定等類集合,並沒有嚴謹的方法。但是一般可依照下列的原則:
- 如果輸入條件是一個範圍,可以定義一個有效的等類集合和兩個無效的等類集合。
- 如果輸入條件需要特定的值,可以定義一個有效的等類集合和兩個無效的等類集合。
- 如果輸入條件代表集合的某個元素,可以定義一個有效的等類集合與一個無效的等類集合。
- 如果輸入條件是布林式,可以定義一個有效的等類集合和一個無效的等類集合。
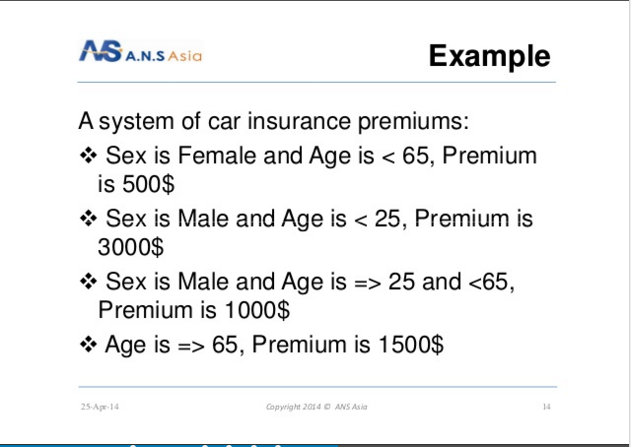
Example
A program reads an input value in the range of 1 and 5000 一個程式讀取一個輸入值,範圍在1到5000之間:
- 計算輸入值的平方根值
有3個等類
- 一個有效與2個無效等類集合被定義出來。
- the set of negative integers, 負整數集合
- set of integers in the range of 1 and 5000, 1~5000整數集合
- integers larger than 5000. 大於5000整數集合
- 一個有效與2個無效等類集合被定義出來。

- 測試組合必須包含:
- 從每一個等類集合找出代表值 representatives from each of the three equivalence classes
- 可能的測試組合為 {-5,500,6000}.
Boundary Value Analysis 邊界值分析
- 一些典型的程式錯誤發生於:
Some typical programming faults occur
- 等類集合的邊界 at boundaries of equivalence classes
- 可能單純起因是心理因素 might be purely due to psychological factors.
Programmers often fail to see 程式設計師常常看不到
- 需要對等類集合裏的邊界值特別處理 special processing required at the boundaries of equivalence classes.
經驗顯示,輸入值的邊界區域往往比中間更加容易發生失誤。因此選擇等類集合的任意元素,並不保證能找到程式的缺陷。邊界值分析要求測試案例必須落在等類集合的邊界,所以是一種補充等類分割的測試方法。邊界值分析不僅注重輸入條件,也要求從輸出條件中導出測試案例[MYE79]。
類似於等類分割,邊界值分析的一般原則如下:
- 如果輸入條件以a和b爲邊界範圍,則測試案例應包含a、b、略大於a和略小於b的值。
- 如果輸入條件是一組值,測試案例應選擇最大值和最小值,還應當測試略大於最小值的值和略小於最大值的值。
上述原則也適用於輸出條件。 例如,若程式的計算結果落在60到80之間,則測試案例應包含能夠產生最大和最小輸出值的項。
如果程式的資料結構有預定的邊界(例如,陣列的大小為100),則要測試其邊界的資料項目。
程式設計師可能不適當地使用了"<"比較運子,而不是"<="比較運算子
- Boundary value analysis
- 選擇不同的等類集合裏的邊界值做為測試案例 Select test cases at the boundaries of different equivalence classes.
Example
- 一個函式計算一個整數的平方根,其輸入值為1~5000間 For a function that computes the square root of an integer in the range of 1 and 5000
- Test cases must include the values {0,1,5000,5001}.
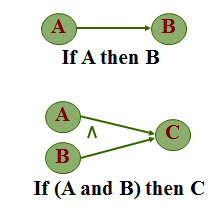
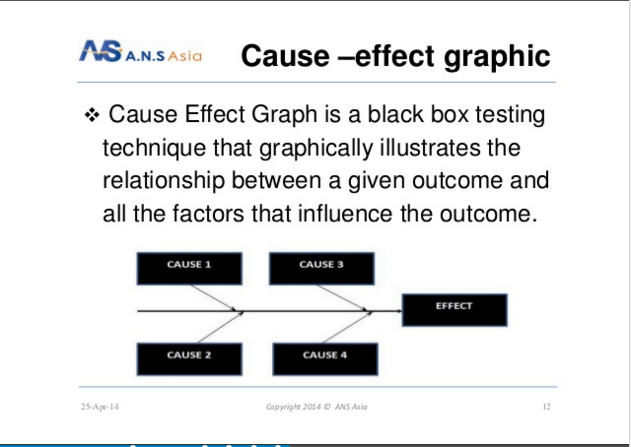
Cause-Effect Graphs
- Restate the requirements in terms of logical relationships between inputs and outputs
- Represent the results as a Boolean graph, called a cause-effect graph
- Provide a systematic view to design functional test cases from requirements specifications
Work first done at IBM
黑箱測試的目的既然是測試系統的功能,那麼就需要對所測試的對象及其物件之間的關係有所理解,並且最好能有一套方法來描述這樣的關係。IBM首先完成這項工作(citation),提出所謂因果圖(Cause-Effect Graph)的概念,以描述系統輸入與輸出之間的邏輯關係。
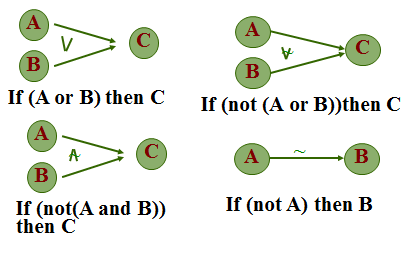
- 圖的表示法是這樣的,節點代表物件,以圓來表示。節點間的連結代表物件間的因果關係,因此有方向性。連結與連結之間,還可以定義邏輯關係,如AND或OR等,因此它是一個布林圖。每個節點代表一個物件的真假,而因果圖即以此得名。
- 果圖提供一個系統化的觀點,從需求規格來設計測試案例。
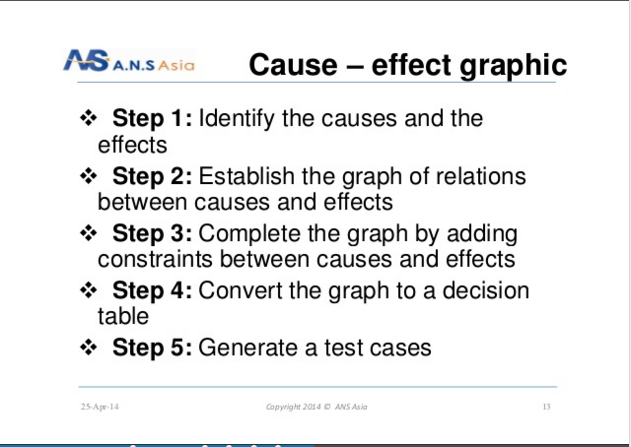
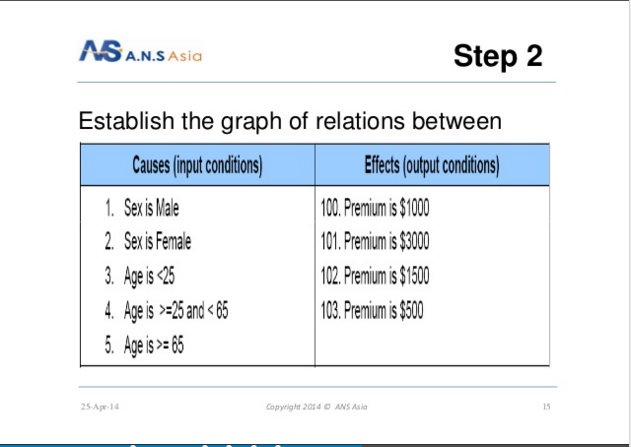
建立因果圖的步驟 Steps to Create a Cause-Effect Graph
- Study the functional requirements.
- Mark and number all causes and effects.
- Numbered causes and effects
- become nodes of the graph.
- Draw causes on the LHS
- Draw effects on the RHS
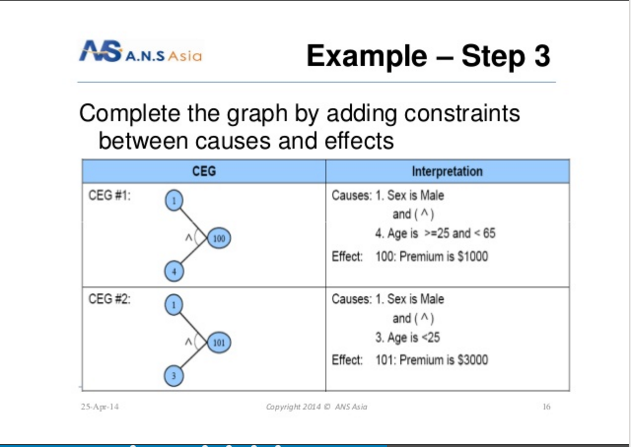
- Draw logical relationship between causes and effects
- as edges in the graph.
- Extra nodes can be added
- to simplify the graph
Drawing the Cause-Effect Graph
範例


Decision Table
Two dimensional mapping of conditions against actions
- Conditions evaluate to Boolean
- Actions correspond to expected activity
- Each column in the table corresponds to a test case for functional testing
Cause-effect graph and decision table are relatives
- Map causes as conditions
- Map effects as actions
測試因果圖還有一個簡單的辦法,就是將因果圖轉換成決策表。決策表是條件對照行為的二維繪圖,不只可作測試之用,也是分析某些特定需求與系統設計的一個非常好的工具,尤其是用於複雜的商業規則。決策表的能力,在於將各種複雜情況分別條列敘述。表一是一個通用的決策表,其中包括四塊區域:條件欄、條件項、作用欄和作用項。表的第一行,是條件欄與作用欄,其餘則是條件項與作用項。表的上半部,是條件攔與條件項,下半部則是作用欄與作用項。
Cause-Effect Graph and Decision Table

- 條件欄列出輸入項的各種情況條件,而作用欄列出各類系統可以執行的活動。除第一行外,表的一行代表一條規則,其中條件項部分可以是「I」,表明該條規則在此一條件欄必須符合該條件,或者「S」表示不能符合該條件,而「X」表示該該情況在此規則不起作用,或者與該規則無關。同理,作用項部分若是「P」,則表示該活動在此規則下會發生,而「A」則表示活動不會發生。
Creating Decision Table from Cause-Effect Graph
- Put a row in the decision table for each cause or effect
- In the example, there are five rows for causes and three for effects.
- The columns of the decision table correspond to test cases.
- Define the columns by examining each effect
- List each combination of causes that can lead to that effect.
- The number of columns in the table depends on
- The number of lines flowing into the effect nodes in the cause-effect graph.
The Benefit 決策表的好處
- Reduce the number of unnecessary test cases
- For example, there are 25 =32 test cases theoretically since there are 5 causes
- Using cause-effect graphing technique have reduced that number to 5 as seen in the table
However, this graphing technique is not suitable for systems which include
- timing constraints, or
- feedback from some other processes.
決策表的好處,是可以很清楚地將系統的功能以條列方式表達。每一條規則,都有清楚的條件說明,以及將發生的行為。因此,從測試的角度來看,它是很好的測試案例指引,其中每條規則至少需要一個測試個案。至於條件欄若不是布林值,而是一個數值範圍,則還需要更多的測試個案,分別測試數值範圍的邊界值(亦即,邊界值分析)。決策表是一個重要的測試工具,不過許多系統分析、設計、程式開發以及測試人員並不熟悉此一技術。